The goal of ‘bulletcp’ is to easily automate the identification of
groove locations via a Bayesian changepoint model on data which are 2D
crossections of 3D bullet land scans. Ultimately, this package will
potentially support other packages implementing automated bullet land
matching algorithms for use by forensic scientists or statisticians. The
only function that should ideally be used by a user or another function
is get_grooves_bcp(), which takes minimal arguments (though
several optional arguments can be supplied) and returns a list. Of the
items in the list, the only one that should ideally be needed by anyone
is the one called “groove”: a two element vector of estimated groove
locations.
You can install the released version of ‘bulletcp’ from CRAN with:
install.packages("bulletcp")The ideal usage of the package is now demonstrated on the example data included. First, we show what the data should look like.
library(bulletcp)
#> Loading required package: mvtnorm
#> Loading required package: dplyr
#>
#> Attaching package: 'dplyr'
#> The following objects are masked from 'package:stats':
#>
#> filter, lag
#> The following objects are masked from 'package:base':
#>
#> intersect, setdiff, setequal, union
#> Loading required package: assertthat
library(ggplot2)
data("example_data")
head(raw_data)
#> x value
#> 1 0.000 NA
#> 2 0.645 NA
#> 3 1.290 NA
#> 4 1.935 NA
#> 5 2.580 NA
#> 6 3.225 NA
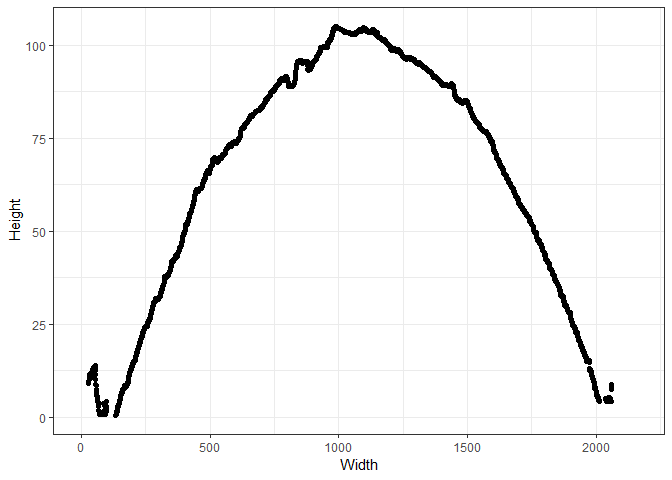
ggplot(data = raw_data) +
geom_point(aes(x = x, y = value)) +
theme_bw() +
ylab("Height") +
xlab("Width")
#> Warning: Removed 323 rows containing missing values (geom_point).
Next, we use the get_grooves_bcp() function on the raw
data to get the groove locations. Downsampled data are used here for
speed, but in practice the full data should be used.
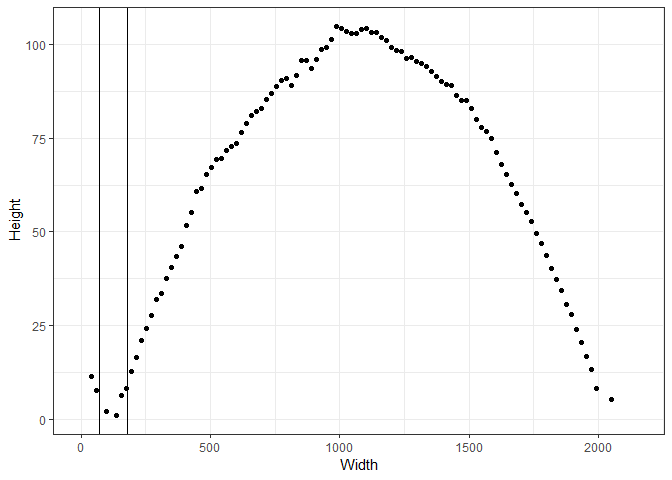
# Estimate the groove locations by supplying additional arguments
raw_data <- raw_data[seq(from = 1, to = nrow(raw_data), by = 30),]
cp_gibbs <- get_grooves_bcp(x = raw_data$x, value = raw_data$value, adjust = 30, iter = 2000)

# Estimated groove locations
cp_gibbs$groove
#> [1]  68.7000 178.0647

ggplot(data = raw_data) +
  geom_point(aes(x = x, y = value)) +
  theme_bw() +
  ylab("Height") +
  xlab("Width") +
  geom_vline(aes(xintercept = cp_gibbs$groove[1])) +
  geom_vline(aes(xintercept = cp_gibbs$groove[2]))
#> Warning: Removed 11 rows containing missing values (geom_point).